[The Montana Professor 2.3, Fall 1992 <http://mtprof.msun.edu>]
Financing Higher Education In Montana
Richard Barrett
Economics
UM-Missoula
Introduction
In 1990, the Education Commission for the Nineties reported that higher education in Montana was facing a serious financial crisis. During most of the previous decade, public funding of higher education, as measured by state and local appropriations per full time equivalent student, had climbed steadily in nominal terms. But when inflation in the higher education price index was accounted for, real per student spending had stagnated. And by the 1989-90 academic year, spending per student in Montana stood at about 80% of the national average./1/
The shortage of funding meant that by virtually any measure, the quality of higher education in Montana was being seriously compromised. Decaying physical plants, inadequate libraries, understocked and outmoded laboratories, and the lowest faculty salaries in the nation, with attendant problems of faculty recruitment and retention, were a few of the obvious signs of decline in the system.
Montanans like to believe that their university system is first rate. Even supporters of substantially improved funding usually argue that the crisis is simply "in the making," rather than already happening. In 1990, however, the Education Commission for the Nineties, despite making reassurances regarding the quality of higher education, found the situation stark enough to call for dramatic fiscal measures. Specifically, the Commission recommended an increase in funding, to occur over five years, that would bring spending per student up to the average for peer institutions. If such a level of funding was deemed to be out of reach, the Commission called for a reduction in enrollment to achieve this peer average.
The recommendations of the Commission were intended to influence the setting of the Governor's 1991-93 biennial budget and the deliberations of the 1991 Legislature, and to some extent they succeeded in doing so. The Governor did support, and the Legislature did approve, a level of spending aimed at closing the gap between Montana's institutions and the peers. By "uncoupling" future funding from enrollment, the Legislature did invite the higher education authorities to reduce enrollment./2/ And finally, after the 1991 Legislative session ended, and it became apparent that despite increased funding, spending per student would not reach the levels recommended by the Commission, the Board of Regents did begin to take tentative steps to reduce enrollment, in a process euphemistically labeled "Commitment To Quality."
Despite these measures, however, the fiscal crisis in higher education today remains as severe as it was two years ago. Swollen enrollments, special session reductions in appropriations, and the limited scope of the Regents' enrollment reduction decisions all mean that the system is financially incapable of addressing even its most serious deficiencies. Anticipated explosive growth in the state budget deficit leaves little hope that the 1993 Legislative session will provide significant relief. And a political, bureaucratic, constitutional, and fiscal logjam seems to make any solution unattainable in the foreseeable future.
How did we get into this mess? And how can we get out of it? A host of players, interests, and circumstances created the situation in which we find ourselves. The purpose of this report is to trace some of the origins of the fiscal crisis in higher education and to propose a strategy for alleviating it.
How the fiscal crisis developed
To trace the origins of the fiscal crisis, we can start with the following reasonable working measure of the fiscal health of higher education:/3/
(Appropriations + Tuition)/Total FTE Enrollment
Arithmetically, the fiscal crisis can be described as the denominator in this ratio being "too big," or the numerator being "too small," and while this is obviously necessarily true, it is not really very helpful. We need to know why enrollment is as high as it is, and why appropriations and tuition are as small as they are. By examining how the determinants of enrollment and revenue in Montana have changed over the past decade, and how they compare to those of the rest of the nation, we can begin to understand where the fiscal crisis came from./4/
Enrollment growth
In 1990, there were 34.1 FTE students in higher education in Montana for every 1000 members of the state's population. This includes students in all types of public institutions: universities, colleges, and vo-techs. For the nation as a whole, the comparable number was 31.4. Montana was thus faced with supporting a significantly higher enrollment load than other states and this abnormal burden contributed to the relative underfunding of higher education in Montana. How did this unusually large enrollment come about?
Enrollment per thousand of population can be expressed as the product of two factors: the number of high school graduates per thousand of population, and the number of FTE higher education students per high school graduate. The first factor expresses the relative size of the potential college attending population; obviously, if we have an unusually large number of high school graduates, we can expect an unusually large higher education enrollment./5/ The second factor reflects the intensity with which the higher education system is used relative to size of the high school graduate pool.
Figure 1 shows how these factors have changed in Montana over the period 1981-1990. In this figure, the yearly values of variables are expressed as percentages of their values in 1981.
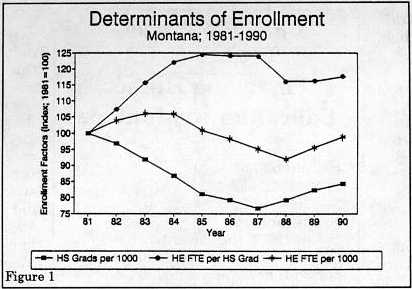
Over the decade, enrollment initially increased, then declined, and finally, from 1988 on, rose sharply. For much of the period, the relative size of the high school graduating population was declining while intensity of use of the system was increasing. These two forces played off against one another until 1988, when both began to rise.
Figure 2 shows how Montana compared to the rest of the nation in these determinants of enrollment during the 1980s.
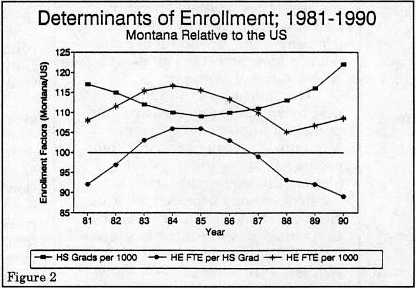
In this figure, yearly Montana values of variables are expressed as percentages of yearly national averages. Throughout the decade, the state far exceeded the nation in numbers of high school graduates; by 1990 there were 13.4 students graduating from Montana high schools per 1000 members of the population, compared to 11 for the nation as a whole. This was the second highest number in the country (Utah, with 13.8, had the highest). On the other hand, Montana consistently fell behind the nation in intensity of use of public higher education. By 1990, the state had 2.54 students enrolled in public higher education (per 1990 high school graduating senior), compared to 2.87 for the nation as a whole. Low intensity of use, however, was not enough to offset high numbers of graduating high school students; as a result, enrollment in Montana was substantially above the national average.
In one important sense, then, Montana's high enrollment is not the result of a higher education program that is "too large" or "too ambitious." Despite the fact that there are colleges, universities, and vo-techs scattered all across Montana with rather modest entrance requirements, the state appears to be doing somewhat less than the rest of the nation to educate the eligible population. By national standards, we are simultaneously doing more than most other states and yet, still not enough!/6/
Enrollment patterns
In another sense, however, the state's system of higher education is unusually ambitious. Throughout most of the 1980s, Montana's institutions allowed for open enrollment: graduates of Montana high schools, without meeting any further qualifying standards, could attend any university, college, or vo-tech they wished. The result was that the pattern of enrollment among institutions was driven exclusively by student preferences; no other rational policy regarding the size of institutions or the provision of educational opportunities existed. The result was a very distinctive enrollment pattern.
Figure 3 shows the 1987-1988 distribution of enrollment by type of institution for Montana and the United States as a whole./7/
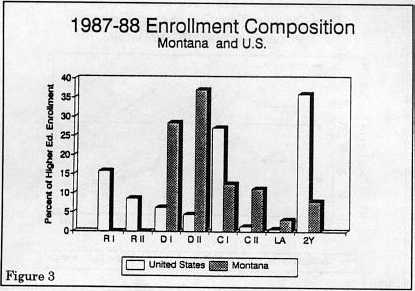
There are two significant differences in these enrollment patterns. First, Montana educates a much larger share (65.4%) of its students at the university level than other states do (35.1%). Second, Montana's two year enrollment, at 7.9%, is smaller than in the rest of the country, which has a two year enrollment of 36%.
Whether the educational needs of Montanans are distinctive enough to justify this unusual enrollment pattern is an open question. But there is no doubt that the pattern is expensive. In 1988 expenditures per student at Montana's universities was 30% higher than the average at the state's public two year institutions./8/ By relying on open enrollment, then, Montana by default has adopted one of the educationally and fiscally most ambitious public higher education policies in the country. The problem is that we have been unwilling to pay for it./9/
Tax revenues
Public expenditures on higher education depend critically on tax revenue. Throughout the last decade, per capita Montana state and local tax revenue rose by about 80%. But by 1990, per capita tax revenue stood at $1,538, while, for the United States as a whole, it was $1,772. At 87% of the national average, Montana was thirtieth among the states on tax collections. Falling behind the nation in tax revenue obviously made it difficult to support higher education at nationally competitive levels.
Taxes per capita can be measured as the product of tax capacity per capita and tax effort. The tax capacity of a state is the amount of tax revenue that could be raised if every tax base in the state (personal income, sales, severance, corporate profits, etc.) were taxed at the national average rate for that type of base. Roughly, tax capacity measures the amount of money that could be raised if the state employed "typical" tax rates. Tax effort is simply the ratio of taxes collected to tax capacity; as its name implies, tax effort measures the extent to which a state exploits its tax capacity./10/
Figure 4 shows how per capita tax capacity, effort, and revenue changed between 1981 and 1990.
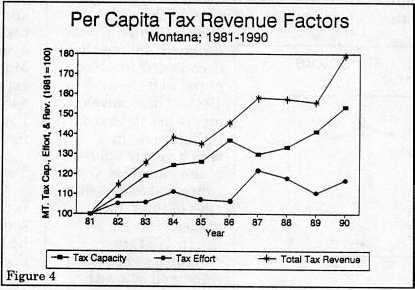
Yearly values of variables are expressed as percentages of their values in 1981. Over the period, nominal tax revenues per capita grew by 80%, due to both a sustained rise in tax capacity and, to a lesser extent, an increase in tax effort. After accounting for inflation, however, real per capita tax revenue grew substantially less, about 18% over the decade, and real per capita tax capacity was essentially unchanged. Finally, when compared to the rest of the nation, Montana's tax capacity and revenue, rather than rising, actually fell sharply.
Figure 5 shows the behavior of per capita tax capacity and revenue and of tax effort in Montana over the decade, with yearly values expressed as percentages of yearly national averages.
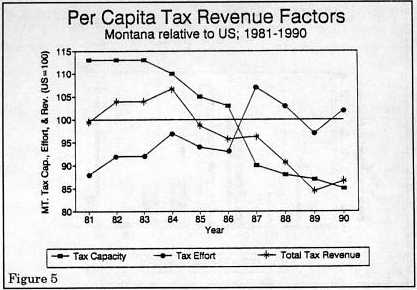
The relative decline in tax capacity reflects the fact that Montana's economy did not share in the sustained economic growth experienced elsewhere in the nation over the decade; by 1990, per capita tax capacity stood at $1,772 for the nation and at $1,506 in Montana./11/ Revenues did not decline as much as capacity because tax effort rose, from well below the national average to slightly above it (102.1 in 1990). By the end of the decade, then, Montanans faced tax burdens that were roughly in line with national averages. But they were generating significantly smaller revenue, due to the troubled state of the economy.
Budget factors
State and local higher education expenditures depend not only on the amount of taxes raised, but their allocation. Over the past decade, tax revenue per FTE student in higher education in Montana increased by about 80%. State and local expenditures grew somewhat less rapidly, however, because the share of tax revenue going to higher education, after rising through 1985, steadily declined, ending the decade at 7.9%, compared to 8.6% in 1981. These developments are depicted in Figure 6, in which yearly values of the variables are expressed as percentages of their 1981 values.
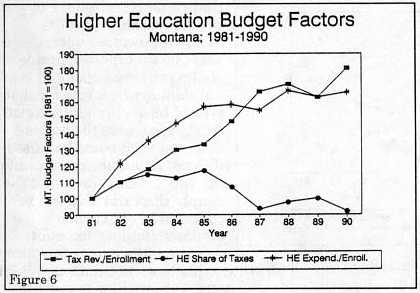
In 1981, tax revenues per student were well below the national average and fell farther behind as tax capacity stagnated. Expenditures per student, relative to the national average, followed much the same pattern, although it is interesting to note that in 1983 and 1984, Montana devoted a significantly larger share of its budget to higher education than other states did, with the result that expenditures per student exceeded the national average./12/
By the end of the decade, Montana was devoting almost exactly the same share of its state and local tax revenues to higher education as were other states. Whether this was the appropriate share depends of course on the nature of other demands on state and local budgets. But given the large numbers of students graduating from Montana's high schools, and the state's apparent desire to maintain open enrollment at the universities, higher education may reasonably claim a larger share of tax revenue than in other states where, typically, the pool of potential students is smaller and the enrollment mix less expensive./13/ Figure 7 depicts Montana taxes and expenditures per student and higher education's share of taxes as percentages of national averages for these variables.
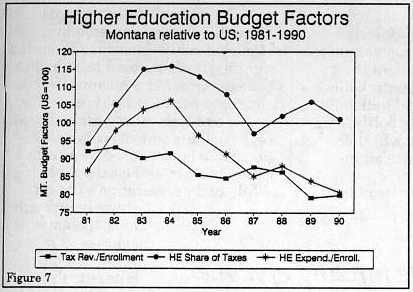
In Montana in 1990, tax revenues and expenditures per student were $45,077 and $3,542 respectively. For the nation, the corresponding figures were $56,373 and $4,388.
Tuition
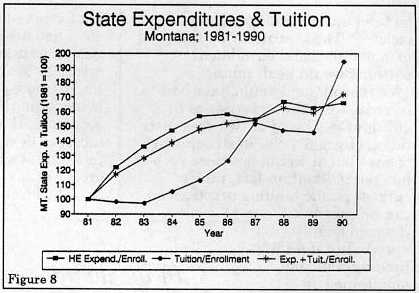
After state and local expenditures, tuition is the most important source of financial support for public higher education. Over the past decade, net tuition revenue per FTE student in Montana grew more rapidly than state and local expenditures per student, although all the extra growth occurred in 1990. For most of the period, growth in tuition lagged behind growth of expenditures. The total of expenditures plus tuition per student closely tracked expenditures per student alone, reflecting the preponderance of expenditures in higher education revenue. These developments are depicted in Figure 8, which shows expenditures per student, tuition per student, and the total of the two, all expressed as percentages of their values in 1981.
Throughout most of the decade, net tuition per student fell substantially below the national average. By 1990, Montana net tuition stood at $1,059, or 76% of the national average of $1,395. State and local expenditures per student were at 78% of the national average. In this sense, at least, the burden of financing higher education, or responsibility for the shortfall in finance, was being shared equally by the public and the student population./14/ Figure 9 shows how tuition and expenditures per student, and the total of the two, all expressed as percentages of national averages, behaved over the decade.
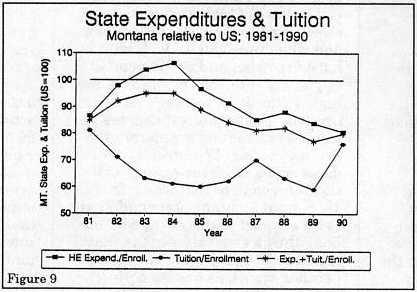
By 1990, the total of tuition plus state and local expenditures per student was $4,601 in Montana and $5,783 for the nation as a whole.
Dealing with the crisis: potential initiatives
It is clear that Montana's higher education funding crisis has its roots not just in one cause--a poor economy, too many students, unwillingness to pay taxes, a tight fisted legislature, an excessively lavish mix of programs, or whatever--but in many. For that reason, there are a variety of initiatives that could be taken to resolve the crisis. None of them is probably sufficient by itself. Some of them may be inappropriate or unpopular. And some of them are difficult, perhaps even impossible, to carry off. Nevertheless, a description of such initiatives, and an analysis of their effects, is the starting point for designing a comprehensive, long term strategy for adequately supporting higher education in Montana. The following discussion is based on figures from 1990 (1989-90 when referring to enrollment, tuition, or other higher education data). This is the last year for which complete, nationally comparable data are available. Although things have changed somewhat in Montana since 1990, much of what could be said about higher education funding then remains valid today and forms a useful framework for considering the alternatives before us.
Enrollment limitations
One initiative that is already under active consideration is limitation of total higher education enrollment. In 1990, if enrollment had been reduced to the national average of 31.4 students per 1000 in the population, and all other determinants of per student revenue (tax capacity, tax effort, budget allocation, net tuition, etc.) had remained the same, revenue per student would have increased by 66% to $4,928, or 85% of the national average. Thus an ostensibly reasonable restriction on enrollment could have a substantial impact on the financial health of the system.
It is important to recognize, however, that virtually all policies to limit enrollment currently under discussion work by reducing an already low rate of utilization of the higher education system. In fact, in order to match national enrollment levels, Montana would have to reduce the number of FTE higher education students per graduating high school senior to 2.34, about 82% of the national average and forty-first among the states.
An alternative to reducing total enrollment would be to employ selective enrollment controls such that the pattern of enrollment, by type of institution, more closely matched that of the rest of the nation. In effect, this would require restricting access to the universities, and shifting students who had been denied admission to four-year and community colleges and vo-techs./15/ The restructuring required to match national enrollment patterns would be dramatic: in 1988, enrollment would have had to be reduced at the universities by 46% and increase at two-year institutions by 356%!/16/ Restructuring of enrollment would not raise revenue per student; in fact, under current public funding practices and tuition schedules it would be reduced. But if total funding could be maintained despite the enrollment shift, total costs would decline significantly and existing funding would go much further to meeting system needs. In 1988, the cost per university student in Montana exceeded the cost per two-year student by approximately $1,480. If enrollment had been restructured to the national pattern, about 7,500 students would have shifted from universities to two-year institutions, for a total cost saving of $11.1 million.
Revenue initiatives
In 1990, Montana's tax effort was slightly above average for the nation, meaning that we were extracting from our tax base about the same revenue as other states, on average, would have. Revenues were short, however, because of limited tax capacity. How, with these limited revenues, could public spending on higher education be increased?
In 1990, an increase in Montana tax capacity to the national average would have allowed an increase in funding per student of 13.6% to $5,250, or 91% of national average funding, assuming that other funding factors--enrollment, tax effort, etc.--had not changed. Unfortunately, as desirable as such an increase in tax capacity might be, it hinges more on the uncontrollable behavior of the state and national economies than on state policy. An increase in tax revenue will therefore almost surely require an increase in tax effort./17/
The level and structure of taxation in Montana are perennial political issues, and while the financial welfare of higher education is closely tied to their resolution, how and when they will be dealt with is hard to predict and will depend little, in any case, on the needs of the higher education system. At present, public interest appears focused on creating a general sales tax, and both gubernatorial candidates appear to favor raising additional revenue in that way. In 1988, total Montana state and local taxes equaled slightly over $1.2 billion; thus a general sales tax that raised $130 million (net of tax relief in other areas), as has been proposed, would increase tax effort substantially, by more than 10%. In 1990, if all the other funding factors (tax capacity, enrollment, budget allocation, tuition, etc.) had not changed, a 10% increase in tax effort would have increased funding per student by 7% to $4,942, or 85% of the national average. Thus, a tax increase of the magnitude currently under discussion in Montana, while capable of financing significant improvements in higher education, could not by itself eliminate the funding crisis.
In addition to an increase in tax revenues, funding of higher education could be improved by a reallocation of state and local budgets. While higher education's budget share is currently near the national average, it is low when the very large number of new Montana high school graduates is taken into account. In 1988, for the nation as a whole, the share of state and local taxes going to higher education was about 7.1 times the percentage of the population graduating from high school that year. If Montana had matched this standard, the higher education share of taxes would have been 9.5%, rather than the 7.9% it actually was. With other funding factors unchanged, revenue per student would have increased 15.6% to $5,343 or 92% of the national average./18/ Thus, a plausible improvement in the higher education budget priority could contribute substantially to alleviating the funding crisis.
Finally, any concerted effort to resolve the financial crisis could include an increase in tuition. If, in 1990, Montana tuition had been at the national average, and all other funding factors had been the same, funding per student would have increased by 7.3% to $4,957, or 86% of the national average.
Resolving the crisis
Can we achieve adequate funding of higher education, as it is currently structured and at current enrollment levels, in Montana? Technically, yes. As the foregoing discussion of revenue initiatives indicates, we could, by increasing taxes and tuition levels and by sharply redirecting state and local budgets, raise revenue per student to something like nationally or regionally competitive levels. But the question is not simply one of budgetary arithmetic. It also involves competing claims on government budgets, the fiscal health of other important programs, and one of the most volatile issues in modern political life: taxation. And the simple fact is that whether or not we have had the wherewithal to support the current system adequately, for the past ten years we have not been willing to do so. On the contrary, we have allowed steady deterioration of funding to push Montana to the bottom of the national heap.
Unless we are willing to live with the implications of this kind of financial starvation, or, on the contrary, are willing to support the system much more vigorously than we have in the past, we need to make some important choices. Fundamentally, we need to decide what kind of educational opportunities we should provide ourselves with. In the interests of the educational needs of students, in our commitment to equality of opportunity, out of our concern for the social and economic future of the state, what kinds of institutions and programs should we have? How big should they be? How should access to them be governed? How much can we afford to spend on them? How must our current system be restructured to meet these needs?
Restructuring of higher education, if it is to occur, raises a host of additional issues. If we move to greater reliance on two-year institutions, and particularly community colleges, how should financial responsibility for them be shared between state and local governments? If universities are downsized, what is to become of their physical plants? How will limitation of access affect different programs and departments within the universities?
For the faculties, restructuring raises issues which must be addressed in academic senates and through collective bargaining. Does restructuring involve the transfer of faculty between institutions? Will professional duties change? Will positions be eliminated and if so, in which programs and through what procedures? Can early retirement programs ease the restructuring process? Will the academic integrity of institutions be maintained?
Solving these problems obviously requires that Regents, faculty, students, the Legislature, the Governor, and the public work cooperatively and plan for the long term. Unfortunately, the current system of higher education funding militates against both cooperative and long term decision making.
Since the mid-1970s, the Montana university system evolved under a funding mechanism with two critical characteristics. First, a major proportion of institutional budgets was enrollment driven. This created an incentive for the institutions to recruit students as actively as possible and a disincentive to examine questions of appropriate size, program mix, and access. Jointly, open access and enrollment-driven funding created budgetary demands that eventually could not be met. In 1991, the Legislature attempted to "uncouple" funding from enrollment, by guaranteeing that base budgets going into the 1993 session would not be reduced, even if enrollment declined. The Regents responded appropriately, if tentatively, to this change in incentives by initiating enrollment limits./19/ But this prompted several legislators in turn to decry limitations on access to the University system, with the implicit threat that funding for the system could be affected after all. Thus the funding system operated in a way that made it impossible to strike a balance between the competing concerns of the legislature (for access and control of appropriations) and the Regents (for quality and control of the system).
A second critical feature of the funding system is that every two years it reinvents the financial "rules of the game" under which higher education is to operate. In the past fifteen years, the funding system, although fundamentally enrollment driven, has gone through a bewildering assortment of funding formulae, "peer catch-up" schedules, lists of peer institutions, and so forth. Even more telling, despite its best intentions to devise ever more sophisticated approaches to funding, under the press of successive budgetary crises, the Legislature more often than not has been forced to abandon the funding levels those approaches would have provided for. The result is that the Board of Regents and the institutions of the system really have very little incentive to plan for events beyond the current biennium. A longer planning horizon would take them into financial terra incognita. A related issue concerns the inability of institutions to carry new revenue or savings from one biennium to another. If, for example, new revenues generated in one biennium result in offsetting reductions in state appropriations in the next, incentives for generating such revenues are substantially weakened.
Adequate funding for higher education will not emerge in the current environment of budget deficits, partisan tax politics, chaotically unstable budgeting practices, emergency funding decisions, and chronic rivalry between the Legislature and the Board of Regents. We need instead new procedures and new leadership which will allow us to structure our future cooperatively and farsightedly. The alternative is to prolong ten years of shameful neglect.
Notes
-
These figures refer to total state and local appropriations per FTE student in all types of post-secondary institutions (universities, four-year and community colleges, vocational-technical schools, etc.).[Back]
-
Funding was "uncoupled" from enrollment by including language in the 1991 appropriations bill which stated that the level of funding in that bill would become the funding base going into the 1993 appropriations process, regardless of enrollment changes that might occur in the interim. Thus, enrollment reductions would not be penalized, nor increases rewarded.[Back]
-
This measure focuses on tuition and state and local appropriations, which are the major sources of revenue in public higher education. Grants, research overhead, gifts, etc., also contribute to the fiscal strength of institutions, but are not included in this analysis.[Back]
-
All of the data reported here are published in Kent Halstead, State Profiles: Financing Public Higher Education 1978 to 1990 (Washington: Research Associates of Washington). Where years are referred to in figures and text in connection with enrollment, appropriations, and tuition, they refer to ending academic years, e.g., 1990 refers to the academic year 1989-90. In all other cases they refer to calendar years.[Back]
-
The growth of non-traditional enrollment means that most institutions draw students from a broader population than just recent high school graduates. Nevertheless, high school graduates make up the single most identifiable and measurable group with high demand for higher education.[Back]
-
From 1984 to 1988, 67% of resident first-time freshmen attended in-state institutions. For the nation as a whole, this figure was 75% and Montana was 35th among the states in retention of resident freshmen. 10% of resident freshmen studied at out-of-state public institutions, compared to 6% for the nation, placing Montana 12th as an exporter of resident freshmen. There is anecdotal evidence that the most academically capable high school graduates leave the state to study elsewhere. If this is true, and if underfunding and concomitant lowering of quality are the cause, then the state's higher education system is promoting a form of "brain drain."[Back]
-
Institutions are classified in Figure 3 as first- and second-level research universities (RI and RII), first- and second-level doctoral universities (DI and DII), first- and second-level comprehensive colleges (CI and CII), liberal arts colleges (LA), and two-year institutions (2Y). The University of Montana and Montana State University are classified as first- and second-level doctoral universities, respectively. Thus, Montana has no research universities by this definition.[Back]
-
Nationally, expenditures per student at universities like Montana's were 48% higher than those at public two-year institutions. The university/two-year cost differential is smaller in Montana because the universities are the most severely underfunded of the state's institutions.[Back]
-
It might be argued that the enrollment pattern is not simply a reflection of student preferences, but results from the mix of opportunities available to Montana students. Two-year enrollment, for example, might be larger if there were more two-year institutions or a greater variety of programs offered at existing institutions. This may be; legislative appropriations and educational policy decisions, however, are still predominately driven by the pattern of enrollment demand.[Back]
-
If tax effort equals 1, it is not necessarily the case that the state is taxing each of its tax bases at the national average. Montana's tax effort, for example, fluctuated around 1 during the 1980s, but the state has never taxed general sales. On the other hand, Montana does tax coal sales more heavily than the national average. A higher tax effort also does not necessarily imply a greater burden on the state's residents. If a particular tax can be exported, then tax effort can be increased by raising that tax rate, without any significant impact on residents.[Back]
-
In 1991 Montana's economy grew much more rapidly than the nation's. This probably served to narrow the gap in tax capacity that developed through the preceding decade.[Back]
-
State and local expenditures per student above the national average did not result in equality between units of the university system and their peers for a number of reasons. First, the figure includes expenditures on vo-techs and community colleges outside the system. Second, tuition revenue per student was well behind the national average. Finally, given the relatively large university enrollment and small two-year enrollment, even if Montana had matched national averages in total spending per student in higher education in general, it could not have done so in spending per student by type of institution.[Back]
-
An approximate measure of the budget priority enjoyed by higher education is the ratio of higher education's share of tax revenue to the number of students graduating from high school per thousand in the population. In 1990, for the nation as a whole, this ratio was .71. Montana, with a ratio of .59, ranked 38th among the states. If budget priority is measured by the ratio of the higher education share of taxes to actual enrollment per thousand population, Montana ranks 30th. Neither of these measures accounts for the composition of enrollment by type of institution.[Back]
-
Tuition increases since 1990 may have shifted the balance somewhat from what it was in 1990. In public discussions of tuition in Montana, it is frequently taken as implicitly "fair" that students should be responsible for the same portion of total revenues as their counterparts at peer institutions. The data in Figure 9 then suggest that the tuition level established in 1990 was fair, but that for most of the preceding decade it was less than fair.[Back]
-
The state's four-year colleges now have a share of total higher education enrollment (26.8%) which is about equal to the national norm for institutions of their type (28.9%). If university enrollment were curtailed, however, students would be displaced towards the four-year colleges, which would impose restrictions in response. Thus, in this cascading process, enrollment would ultimately shift from universities to community colleges.[Back]
-
These numbers are based on 1988 enrollment patterns, the last year for which comparable data are available.[Back]
-
Proponents of "supply side" economics may argue that by reducing tax effort, the state can stimulate economic activity and thereby increase both tax capacity and revenue. Economists are far from unanimous, however, in their findings about the effect of state and local taxation on economic activity. Measured effects, even when statistically significant, are typically modest enough to conclude that reductions in tax effort will not produce fully offsetting increases in tax capacity. Revenue will therefore fall. The issue is additionally complicated by the fact that how taxes are spent affects their impact on economic activity. More higher education spending, for example, is widely believed to promote economic development and therefore expand tax capacity.[Back]
-
If budget share is adjusted to actual enrollment, the effects are much less dramatic: funding per student increases 5.9% to $4,892, or 84% of the national average. In any case, higher education's budget share cannot, and should not, depend exclusively on the relative size of the actual or potential attending population, and even in that regard, cannot simply be expected to match national averages. Nevertheless, by these standards the higher education priority is low and for that reason bears examination.[Back]
-
These were not enrollment reductions, but caps set at slightly above current enrollment levels.[Back]
[The Montana Professor 2.3, Fall 1992 <http://mtprof.msun.edu>]
Contents | Home